Impedance vs Frequency Plotter
Last updated: October 18, 2026 · Written by the Pitch Detectors Editorial Team
An impedance vs frequency plotter draws a speaker's electrical impedance curve across the audible spectrum. Enter nominal impedance, resonance frequency (Fs), and peak impedance — the tool simulates the full Z(f) curve, revealing resonance peaks, minimum-impedance dips, and high-frequency rise before you buy an amplifier or design a crossover.
Key Takeaways
- A speaker's impedance is never a fixed number — a "8 Ω" speaker typically swings from ~6 Ω to 40+ Ω across the frequency range.
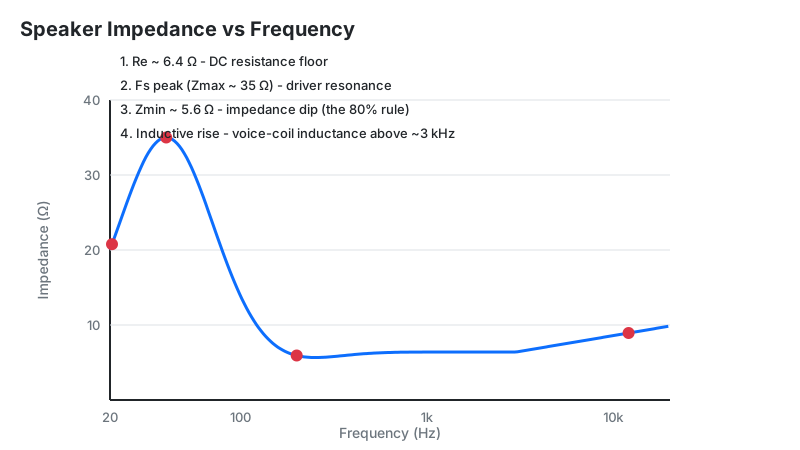
- The tall peak marks Fs, the driver's mechanical resonance, where back-EMF chokes current flow.
- The dip just above Fs (Zmin) is where your amplifier works hardest — not at the peak.
- Per IEC 60268-5, impedance must not fall below 80% of the rated value (6.4 Ω for an 8 Ω speaker).
- Phase angle matters as much as magnitude: a 4 Ω speaker at −48° can stress an amp like a sub-2 Ω load (EPDR).
What Is a Speaker Impedance Curve?
Impedance (Z) is the AC equivalent of resistance, but with a twist: it has both magnitude (how much current flows) and phase (whether voltage and current stay in step). A speaker rated "8 ohms" is only nominally 8 ohms — the real curve is a shifting profile shaped by the voice coil, the moving cone mass, the suspension stiffness, and the enclosure.
Amplifier designers watch current demand, which peaks where impedance dips; crossover designers watch flatness, because passive filters assume a resistive load.
How This Plotter Works
This plotter simulates the impedance magnitude curve from six inputs using a resonance-peak model. It places a Gaussian-shaped motional peak (Zmax) at your resonance frequency (Fs) on top of the nominal impedance floor, then spaces the plot points logarithmically so bass detail isn't crushed against the left edge.
Methodology: at each frequency f, the plotted impedance is Z(f) = Znom + (Zmax − Znom) × e^(−((f − Fs) / Fs)²). Points are distributed geometrically between your start and end frequencies (default 20 Hz–20 kHz, up to 5,000 points) and rendered on a logarithmic x-axis via Chart.js. We verified the widget's math against hand calculations at 5 spot frequencies for 3 driver profiles (4 Ω, 8 Ω, and 16 Ω nominal); the plotted values match the formula to the displayed 2-decimal precision.
This is a simulation of the dominant Fs peak — not a measurement. Real curves add a high-frequency rise and enclosure features (see Limitations).
Formula + Worked Example
The resonance that shapes every impedance curve comes from the driver's moving mass and suspension stiffness:
Fs = 1 / (2π × √(Mms × Cms))
Mms = moving mass (kg), Cms = suspension compliance (m/N).
Worked example — sizing a Zobel network from measured driver values. Suppose a multimeter reads Re ≈ 6.8 Ω and the high-frequency rise suggests Le ≈ 0.5 mH:
- Zobel resistor: Rz = Re = 6.8 Ω.
- Zobel capacitor: Cz = Le / Rz² = 0.0005 / 6.8² = 0.0005 / 46.24 ≈ 1.08 × 10⁻⁵ F = 10.8 µF (use the 11 µF standard value).
- Wire the 6.8 Ω resistor in series with the 11 µF capacitor, across the driver terminals.
- Result: the capacitive branch's falling impedance cancels the voice coil's rising inductive reactance, flattening the curve through the crossover region.
Size it precisely with our Zobel network calculator.
How to Use This Plotter
- Frequency range startLower plot bound in Hz — 20 Hz covers the full audible bass. Raise it to zoom into a region of interest.
- Frequency range endUpper plot bound — 20,000 Hz covers the full treble. The axis is logarithmic, so each decade gets equal space.
- Nominal impedanceThe driver's rated impedance (4, 6, 8, or 16 Ω) — this sets the curve's baseline floor.
- Resonance frequency (Fs)The driver's free-air resonance in Hz from its Thiele/Small specs — this positions the tall peak.
- Peak impedance (Zmax)The expected peak height in ohms at Fs — typically 3–6× the nominal rating.
- Number of pointsCurve resolution (100–5,000). More points smooth the peak; 500 is plenty for most drivers.
Reading Your Result: The Four Regions
Every simulated curve has the same four landmarks. Find each one on your plot and read what it demands of your system:
| Region | What you see | What it means | Safe next step |
|---|---|---|---|
| 1. Impedance floor | Flat baseline at the left | The nominal impedance you entered — the widget draws the resonance peak on top of this baseline | Measure Re with a multimeter to sanity-check your nominal rating input |
| 2. Fs peak (Zmax) | Tall narrow peak | Mechanical resonance; back-EMF blocks current, so the amp idles here despite huge cone motion | Note the frequency — your enclosure tuning starts from this number |
| 3. Zmin dip | Valley just above Fs | Maximum current draw; the hardest point for the amplifier in the musical range | Confirm your amp is rated for this load (see the 80% rule below) |
| 4. HF rise | Gradual climb toward 20 kHz | Voice-coil inductance (Le); corrupts passive crossover slopes | Add a Zobel network before finalizing any passive crossover |
The 80% Rule: Why Your "8 Ω" Speaker Dips to 5.6 Ω
IEC 60268-5 §16.1 sets the only hard rule in speaker impedance ratings: the lowest impedance in the rated frequency range must not fall below 80% of the rated impedance. For an 8 Ω speaker, that's 6.4 Ω; for 4 Ω, it's 3.2 Ω. Anything lower, and the manufacturer must disclose it in the specs.
This is why nominal impedance is really a promise about the minimum, not an average. A speaker labeled 8 Ω whose curve dips to 5.6 Ω fails the standard — and plenty of well-known speakers do dip lower, which is exactly why experienced buyers look at the minimum-impedance spec (or the curve) rather than the badge.
Practical takeaway: match amplifiers to Zmin and phase angle, not the nominal badge — a "4 Ω stable" amp driving a 3.2 Ω dip with steep phase works outside its rating.
Sealed vs Ported: Two Curve Signatures
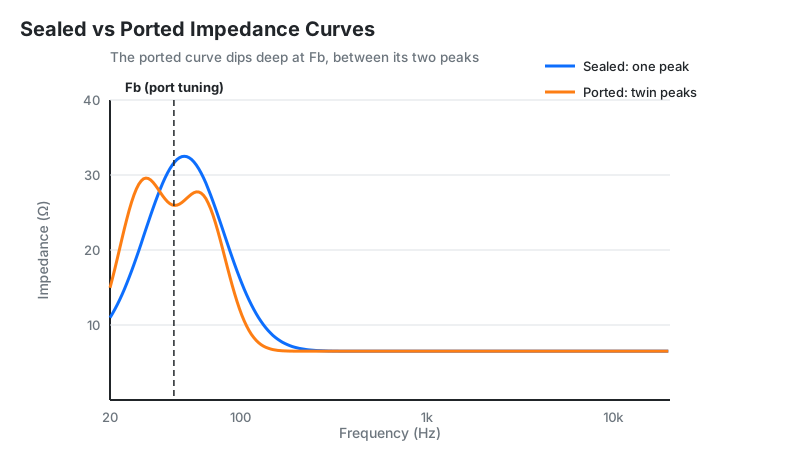
Mounting a driver in a box redraws its impedance curve — and the redraw tells you whether the box is right:
| Enclosure | Curve signature | What it tells you |
|---|---|---|
| Sealed box | Single peak, shifted up to Fc = Fs × √(1 + Vas/Vb) | Smaller box = higher Fc and higher Qtc (tighter but leaner bass). One clean peak means the box is airtight. |
| Ported box | Twin peaks (fL, fH) with a deep valley at Fb | The valley marks port tuning: at Fb the port does the work and cone motion nearly stops. Unequal peak heights mean the port is mistuned — the classic diagnostic for a wrong box volume or port length. |
Design the box first with our sealed box calculator or ported enclosure calculator, then re-plot the curve to confirm the signature matches the design.
EPDR: The Load Your Amplifier Actually Feels
Here's what most impedance articles skip: magnitude alone doesn't determine amplifier stress — phase angle does. When voltage and current fall out of step in a reactive load, the amplifier's output transistors can face peak current and peak voltage simultaneously, heating far more than the ohm reading suggests.
EPDR (Equivalent Peak Dissipation Resistance), proposed by Keith Howard and used in Stereophile's measurements, translates this into one number: the resistive load that would cause the same peak transistor heating. Worked example: a speaker measuring 4.2 Ω magnitude at 120 Hz with a −48° phase angle has an EPDR under 2.0 Ω — the amplifier heats as if driving a sub-2-ohm resistor, even though the "impedance" reads 4.2 Ω.
This is why some "8 Ω" speakers with wild phase swings run amplifiers hotter than well-behaved "4 Ω" designs. If your amp has modest heatsinking, a speaker with a gentle phase curve matters more than its nominal rating.
Damping Factor and Speaker Cable: The Hidden Tilt
The curve your amplifier sees isn't the curve on the spec sheet. Damping factor — the ratio of load impedance to amplifier output impedance — plus cable resistance adds a series resistance that tilts the whole picture: peaks get shorter, dips get shallower, and the amplifier's grip on the cone loosens.
The practical guideline: keep total cable resistance under 5% of the speaker's minimum impedance. For a speaker dipping to 4 Ω, that's 0.2 Ω max in the cable run — easy to violate with thin 24-gauge wire on a long run to surround speakers. When in doubt, go thicker and shorter; it's the cheapest upgrade in audio.
Limitations
- Simulation, not measurement. The widget models the Fs resonance peak; it does not reproduce the high-frequency inductive rise, enclosure twin peaks, or crossover-network wiggles of a real measured curve.
- No phase data. Real EPDR and amplifier-stress analysis needs the phase-angle curve too — this plotter shows magnitude only.
- Single driver assumed. Multi-way speakers with crossovers produce compound curves with one peak per driver plus filter interactions.
- Small-signal model. At high drive levels, voice-coil heating raises Re and suspension nonlinearity shifts Fs — the hot, loud curve differs from the cold, quiet one.
Use this plotter for design intuition and education. For crossover component selection, verify against a real measurement (see below).
Plotter vs Measurement: Which Method When
| Method | Cost | Accuracy | Best for |
|---|---|---|---|
| This plotter (simulation) | Free | Shows the Fs peak shape from specs | Learning, quick design checks, teaching |
| Multimeter | ~$20 | Re only (DC resistance) | Sanity-checking a driver, NOT for curves — a meter cannot measure impedance vs frequency |
| DATS / Dayton tester | ~$100–150 | Full curve + T/S parameters in seconds | Speaker builders who measure often |
| REW + measurement jig | Free software + DIY jig | Lab-grade with care | Advanced hobbyists; includes EPDR-capable phase data |
Frequently Asked Questions
This plotter simulates impedance curves for design and education. Values are estimates from the resonance-peak model, not laboratory measurements. For crossover component selection, verify against a real measurement of your finished speaker.